Monitoring
Dragonfly is recommending to use prometheus for monitoring. Prometheus and grafana configurations are maintained in the dragonflyoss/monitoring repository.
Grafana dashboards are published in grafana.com, and the address of the dashboards are Manager, Scheduler and Peer.
The following Dragonfly monitoring example is based on kubernetes, and uses the prometheus-community/kube-prometheus-stack charts to deploy prometheus and grafana.
Prerequisites
| Name | Version | Document |
|---|---|---|
| Kubernetes cluster | 1.20+ | kubernetes.io |
| Helm | v3.8.0+ | helm.sh |
| Prometheus | v2.40.0+ | prometheus.io |
Setup kubernetes cluster
Kind is recommended if no Kubernetes cluster is available for testing.
Create kind multi-node cluster configuration file kind-config.yaml, configuration content is as follows:
kind: Cluster
apiVersion: kind.x-k8s.io/v1alpha4
nodes:
  - role: control-plane
  - role: worker
  - role: worker
Create a kind multi-node cluster using the configuration file:
kind create cluster --config kind-config.yaml
Switch the context of kubectl to kind cluster:
kubectl config use-context kind-kind
Kind loads Dragonfly image
Pull Dragonfly latest images:
docker pull dragonflyoss/scheduler:latest
docker pull dragonflyoss/manager:latest
docker pull dragonflyoss/client:latest
docker pull dragonflyoss/dfinit:latest
Kind cluster loads Dragonfly latest images:
kind load docker-image dragonflyoss/scheduler:latest
kind load docker-image dragonflyoss/manager:latest
kind load docker-image dragonflyoss/client:latest
kind load docker-image dragonflyoss/dfinit:latest
Create Prometheus and Grafana based on Helm Charts
Install prometheus and grafana based on kube-prometheus-stack.
$ helm repo add prometheus-community https://prometheus-community.github.io/helm-charts
$ helm install --create-namespace --namespace prometheus prometheus prometheus-community/kube-prometheus-stack -f https://raw.githubusercontent.com/dragonflyoss/monitoring/main/prometheus/values.yaml
NAME: prometheus
LAST DEPLOYED: Tue Jun 11 15:37:56 2024
NAMESPACE: default
STATUS: deployed
REVISION: 1
NOTES:
kube-prometheus-stack has been installed. Check its status by running:
  kubectl --namespace default get pods -l "release=prometheus"

Visit https://github.com/prometheus-operator/kube-prometheus for instructions on how to create & configure Alertmanager and Prometheus instances using the Operator.
Check that Prometheus is deployed successfully:
$ kubectl get po -n prometheus
NAME                                                     READY   STATUS    RESTARTS      AGE
alertmanager-prometheus-kube-prometheus-alertmanager-0   2/2     Running   2 (47m ago)   71m
prometheus-grafana-7576556869-jzpsf                      3/3     Running   3 (47m ago)   73m
prometheus-kube-prometheus-operator-fd56bbb4f-29sp6      1/1     Running   2 (47m ago)   73m
prometheus-kube-state-metrics-7d7654ff7-7vtrg            1/1     Running   2 (47m ago)   73m
prometheus-prometheus-kube-prometheus-prometheus-0       2/2     Running   2 (47m ago)   71m
prometheus-prometheus-node-exporter-8dl68                1/1     Running   1 (47m ago)   73m
prometheus-prometheus-node-exporter-jlgcp                1/1     Running   1 (47m ago)   73m
prometheus-prometheus-node-exporter-tlhld                1/1     Running   1 (47m ago)   73m
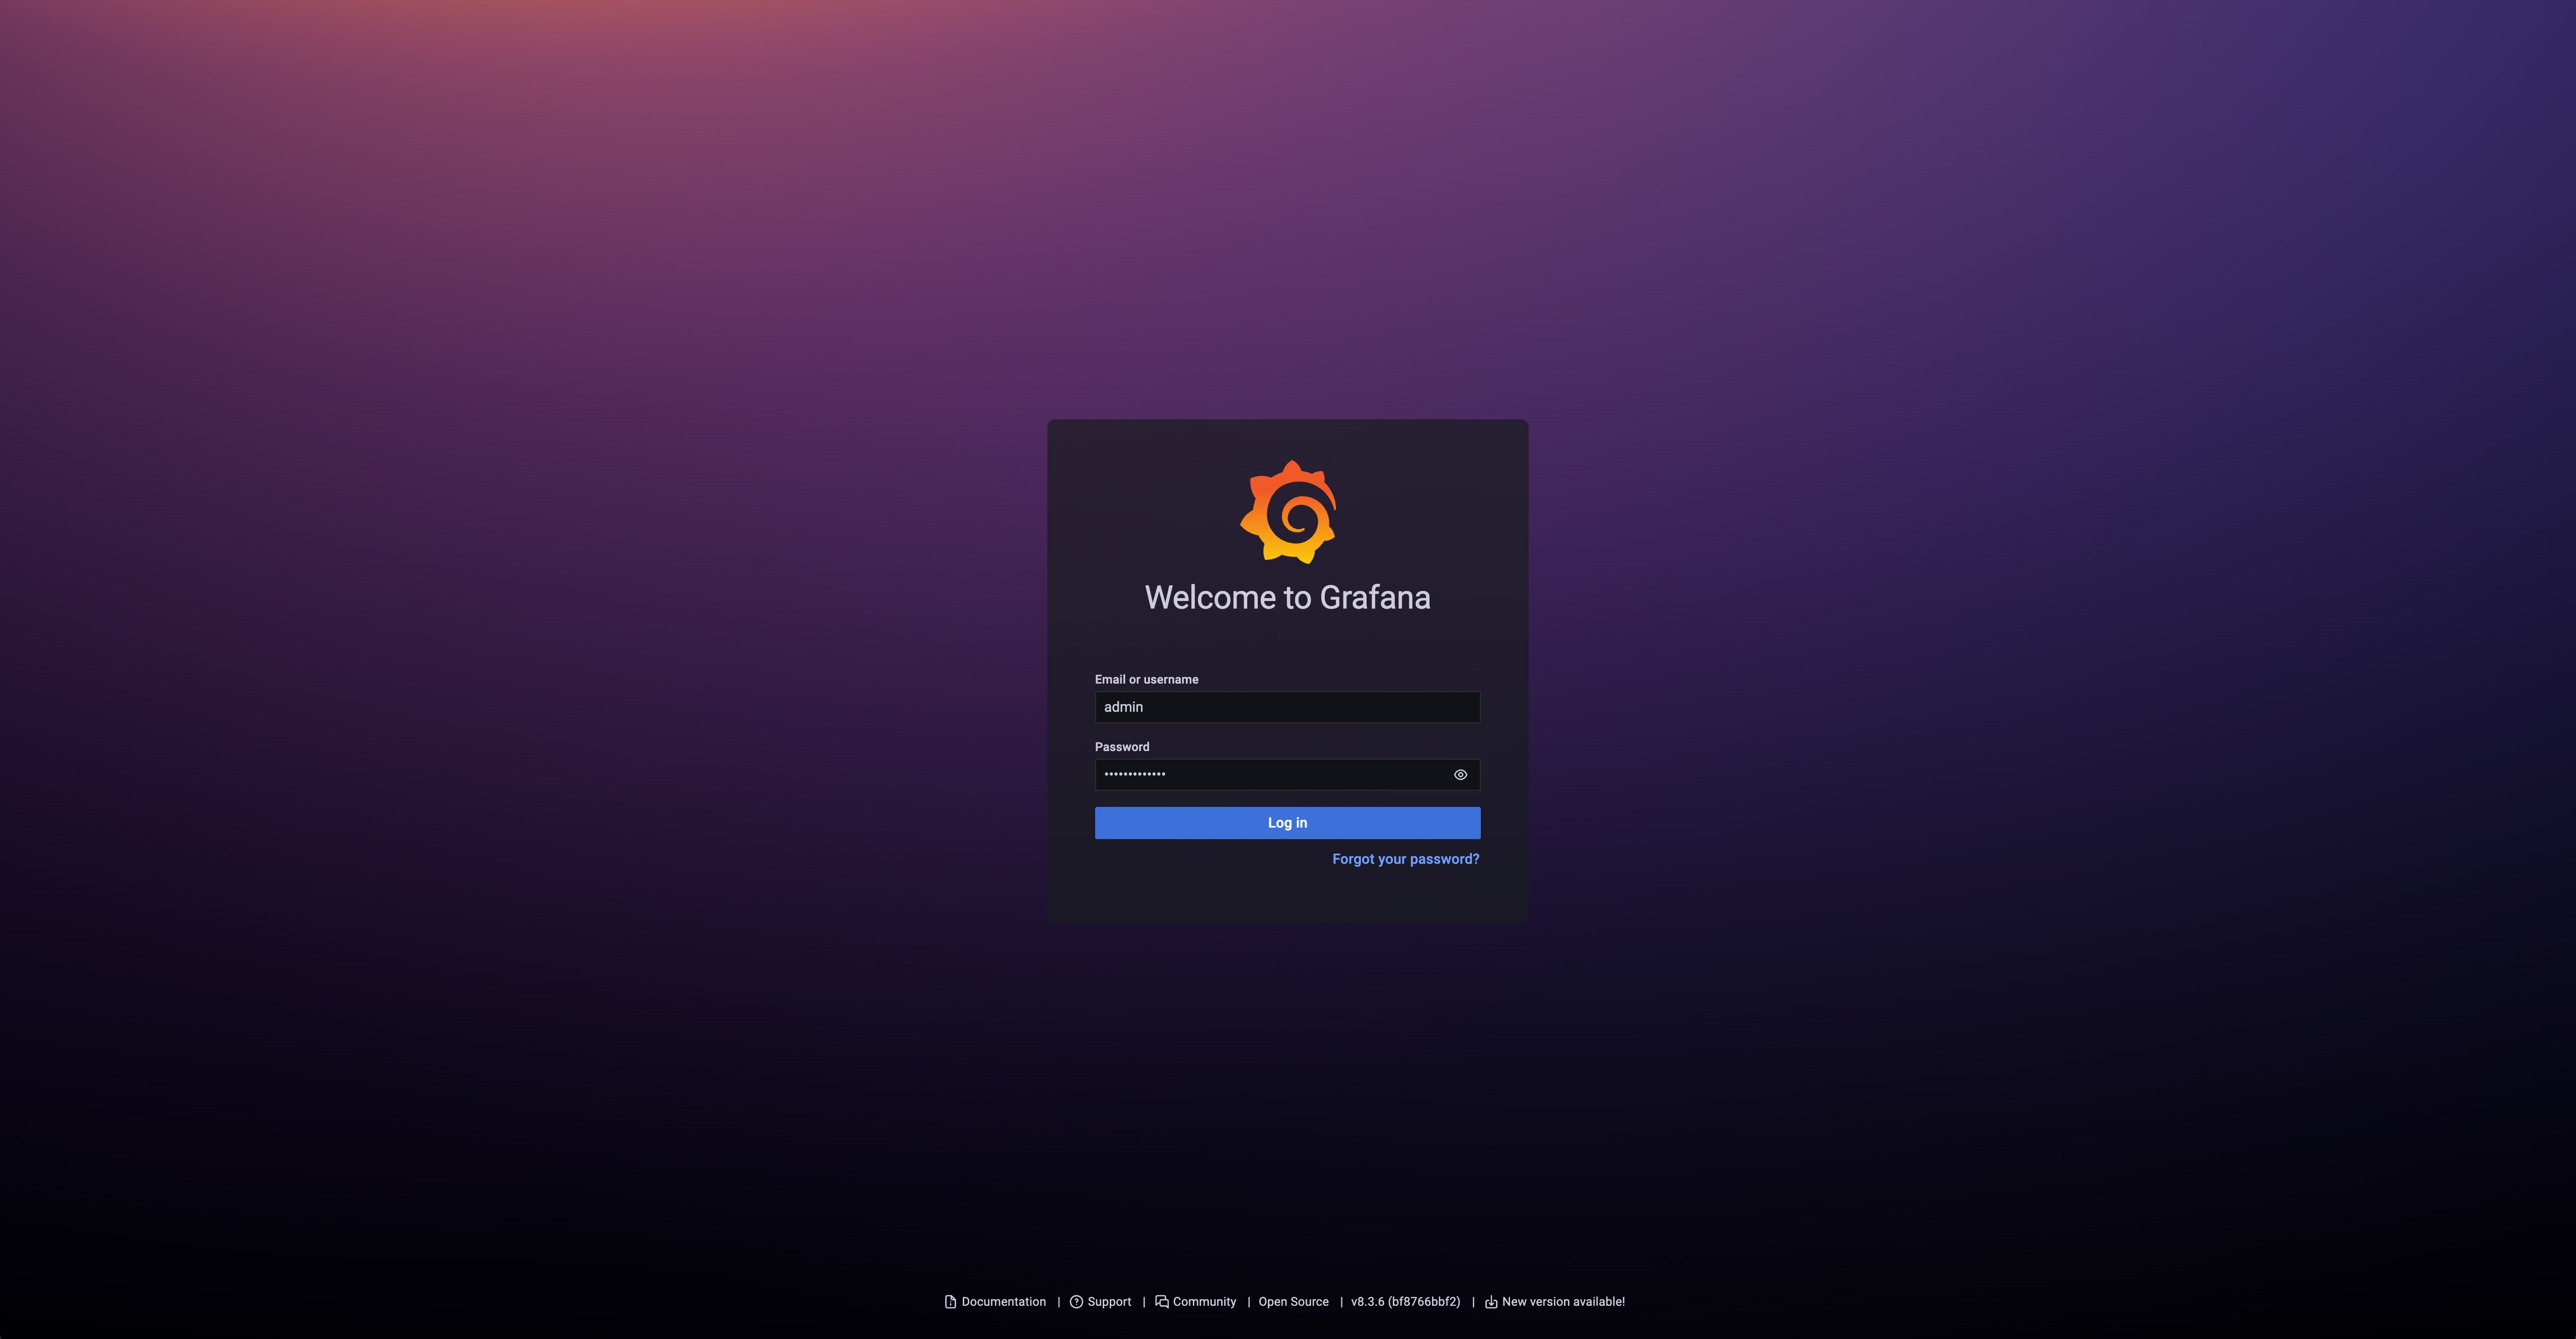
Expose grafana port 8080 and access the address localhost:8080 to see the grafana dashboard,
You can login with username admin and password prom-operator.
kubectl --namespace prometheus port-forward svc/prometheus-grafana 8080:80
Create Dragonfly cluster based on helm charts
Create the Helm Charts configuration file values.yaml, Turn on the ServiceMonitor function, Please refer to the serviceMonitor.
manager:
  image:
    repository: dragonflyoss/manager
    tag: latest
  metrics:
    enable: true
    serviceMonitor:
      enable: true
    prometheusRule:
      enable: true

scheduler:
  image:
    repository: dragonflyoss/scheduler
    tag: latest
  metrics:
    enable: true
    enableHost: true
    serviceMonitor:
      enable: true
    prometheusRule:
      enable: true

seedClient:
  image:
    repository: dragonflyoss/client
    tag: latest
  metrics:
    enable: true
    serviceMonitor:
      enable: true
    prometheusRule:
      enable: true
  config:
    log:
      level: info
    proxy:
      prefetch: true
      registryMirror:
        addr: https://index.docker.io
      rules:
        - regex: blobs/sha256.*

client:
  image:
    repository: dragonflyoss/client
    tag: latest
  metrics:
    enable: true
    serviceMonitor:
      enable: true
    prometheusRule:
      enable: true
  dfinit:
    enable: true
    image:
      repository: dragonflyoss/dfinit
      tag: latest
    config:
      containerRuntime:
        containerd:
          configPath: /etc/containerd/config.toml
          proxyAllregistries: true
  config:
    proxy:
      prefetch: true
      registryMirror:
        addr: https://index.docker.io
      rules:
        - regex: blobs/sha256.*
Create a Dragonfly cluster using the configuration file:
$ helm repo add dragonfly https://dragonflyoss.github.io/helm-charts/
$ helm install --create-namespace --namespace dragonfly-system dragonfly dragonfly/dragonfly -f values.yaml
NAME: dragonfly
LAST DEPLOYED: Tue Jun 11 16:12:19 2024
NAMESPACE: dragonfly-system
STATUS: deployed
REVISION: 1
TEST SUITE: None
NOTES:
1. Get the scheduler address by running these commands:
  export SCHEDULER_POD_NAME=$(kubectl get pods --namespace dragonfly-system -l "app=dragonfly,release=dragonfly,component=scheduler" -o jsonpath={.items[0].metadata.name})
  export SCHEDULER_CONTAINER_PORT=$(kubectl get pod --namespace dragonfly-system $SCHEDULER_POD_NAME -o jsonpath="{.spec.containers[0].ports[0].containerPort}")
  kubectl --namespace dragonfly-system port-forward $SCHEDULER_POD_NAME 8002:$SCHEDULER_CONTAINER_PORT
  echo "Visit http://127.0.0.1:8002 to use your scheduler"

2. Get the dfdaemon port by running these commands:
  export DFDAEMON_POD_NAME=$(kubectl get pods --namespace dragonfly-system -l "app=dragonfly,release=dragonfly,component=dfdaemon" -o jsonpath={.items[0].metadata.name})
  export DFDAEMON_CONTAINER_PORT=$(kubectl get pod --namespace dragonfly-system $DFDAEMON_POD_NAME -o jsonpath="{.spec.containers[0].ports[0].containerPort}")
  You can use $DFDAEMON_CONTAINER_PORT as a proxy port in Node.

3. Configure runtime to use dragonfly:
  https://d7y.io/docs/getting-started/quick-start/kubernetes/
Check that Dragonfly is deployed successfully:
$ kubectl get po -n dragonfly-system
NAME                                 READY   STATUS    RESTARTS   AGE
dragonfly-client-b6vjg               1/1     Running   0          63m
dragonfly-client-mpc7w               1/1     Running   0          63m
dragonfly-manager-6598986b85-22n7k   1/1     Running   0          63m
dragonfly-manager-6598986b85-4lfvv   1/1     Running   0          63m
dragonfly-manager-6598986b85-cngzb   1/1     Running   0          63m
dragonfly-mysql-0                    1/1     Running   0          63m
dragonfly-redis-master-0             1/1     Running   0          63m
dragonfly-redis-replicas-0           1/1     Running   0          63m
dragonfly-redis-replicas-1           1/1     Running   0          61m
dragonfly-redis-replicas-2           1/1     Running   0          61m
dragonfly-scheduler-0                1/1     Running   0          63m
dragonfly-scheduler-1                1/1     Running   0          58m
dragonfly-scheduler-2                1/1     Running   0          45m
dragonfly-seed-client-0              1/1     Running   0          63m
dragonfly-seed-client-1              1/1     Running   0          50m
dragonfly-seed-client-2              1/1     Running   0          47m
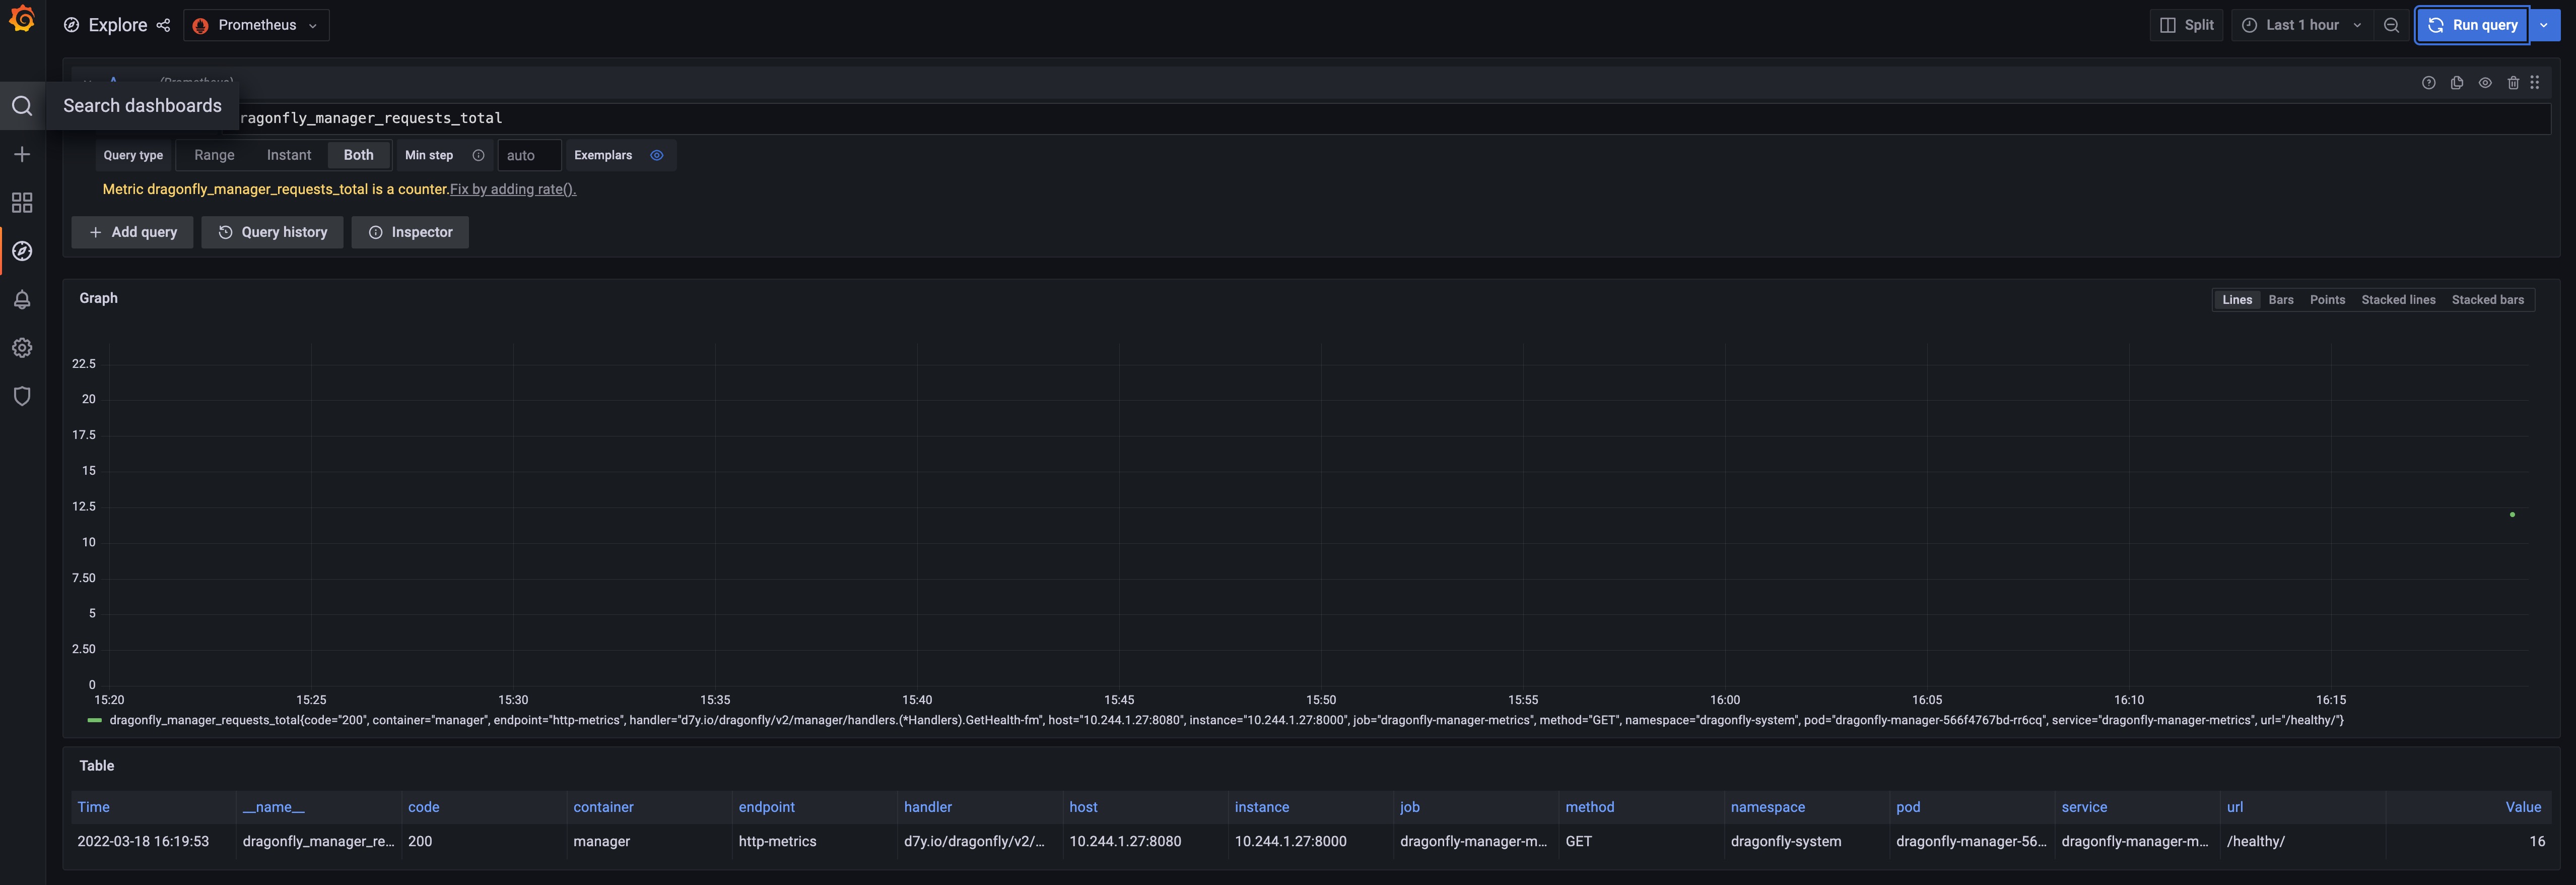
Validate metrics
Visit grafana explore page at localhost:8080/explore and
query dragonfly_manager_requests_total to validate that Dragonfly metrics have been collected.
Import Dragonfly grafana dashboards
Dragonfly grafana dashboard info is:
| Name | ID | Link | Description |
|---|---|---|---|
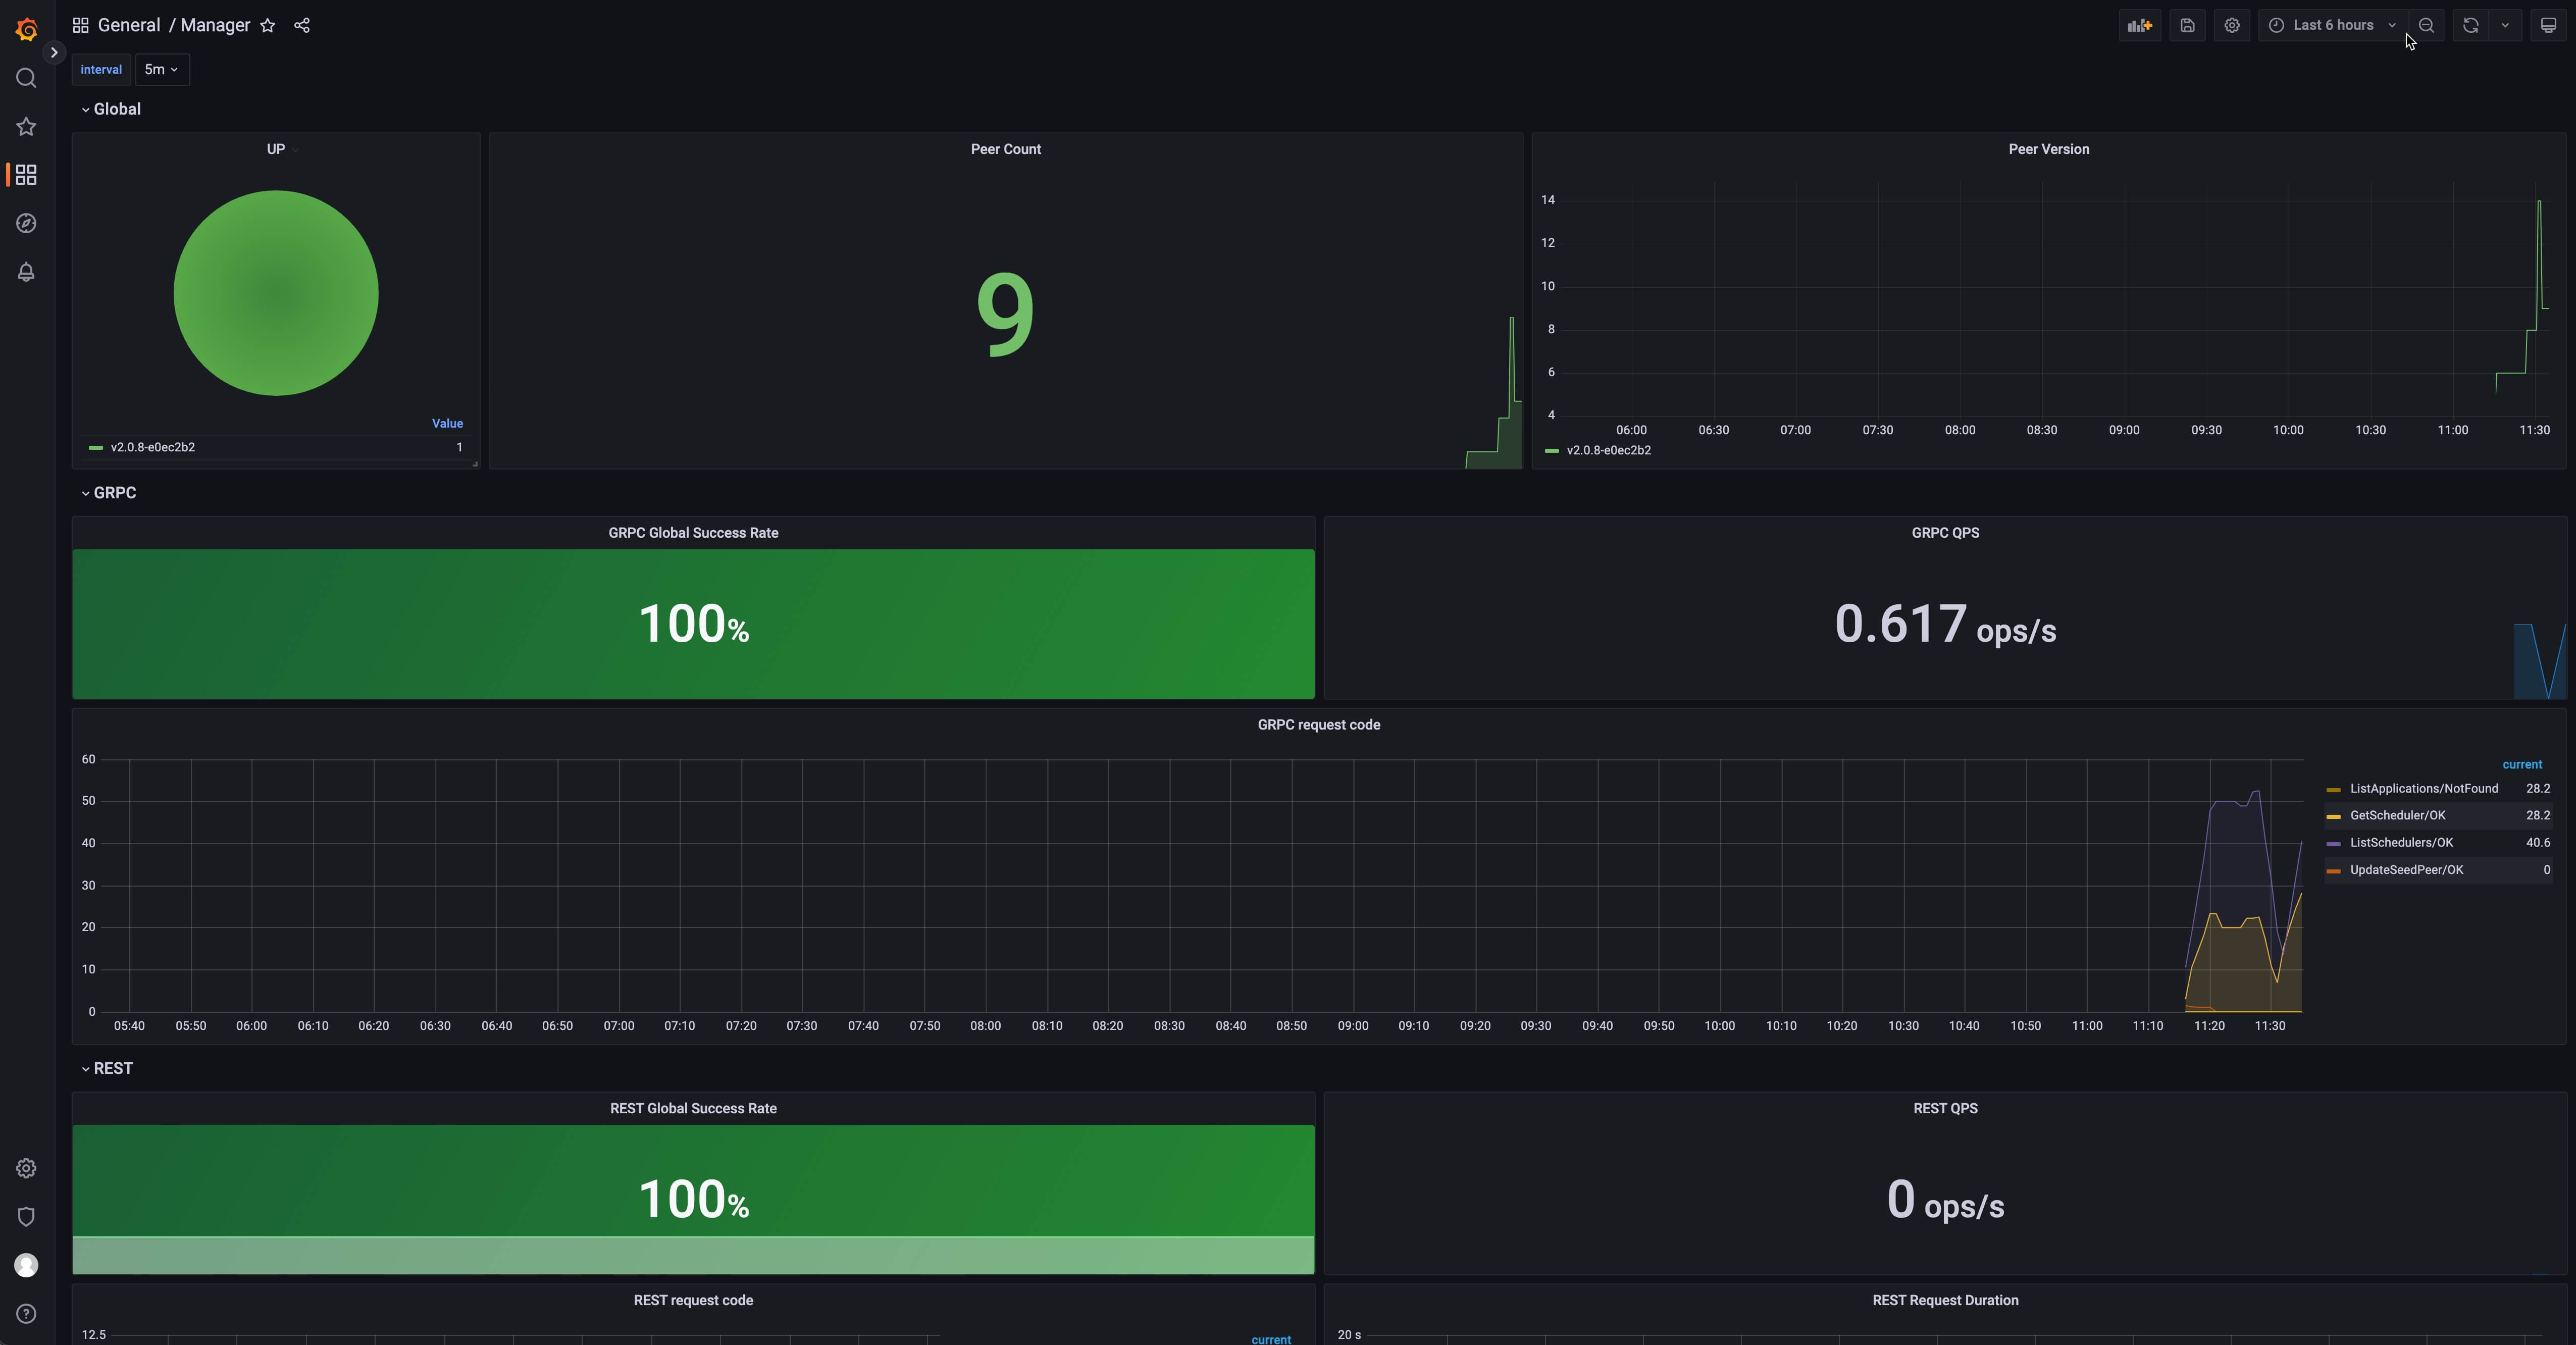
| Dragonfly Manager | 15945 | https://grafana.com/grafana/dashboards/15945 | Grafana dashboard for dragonfly manager. |
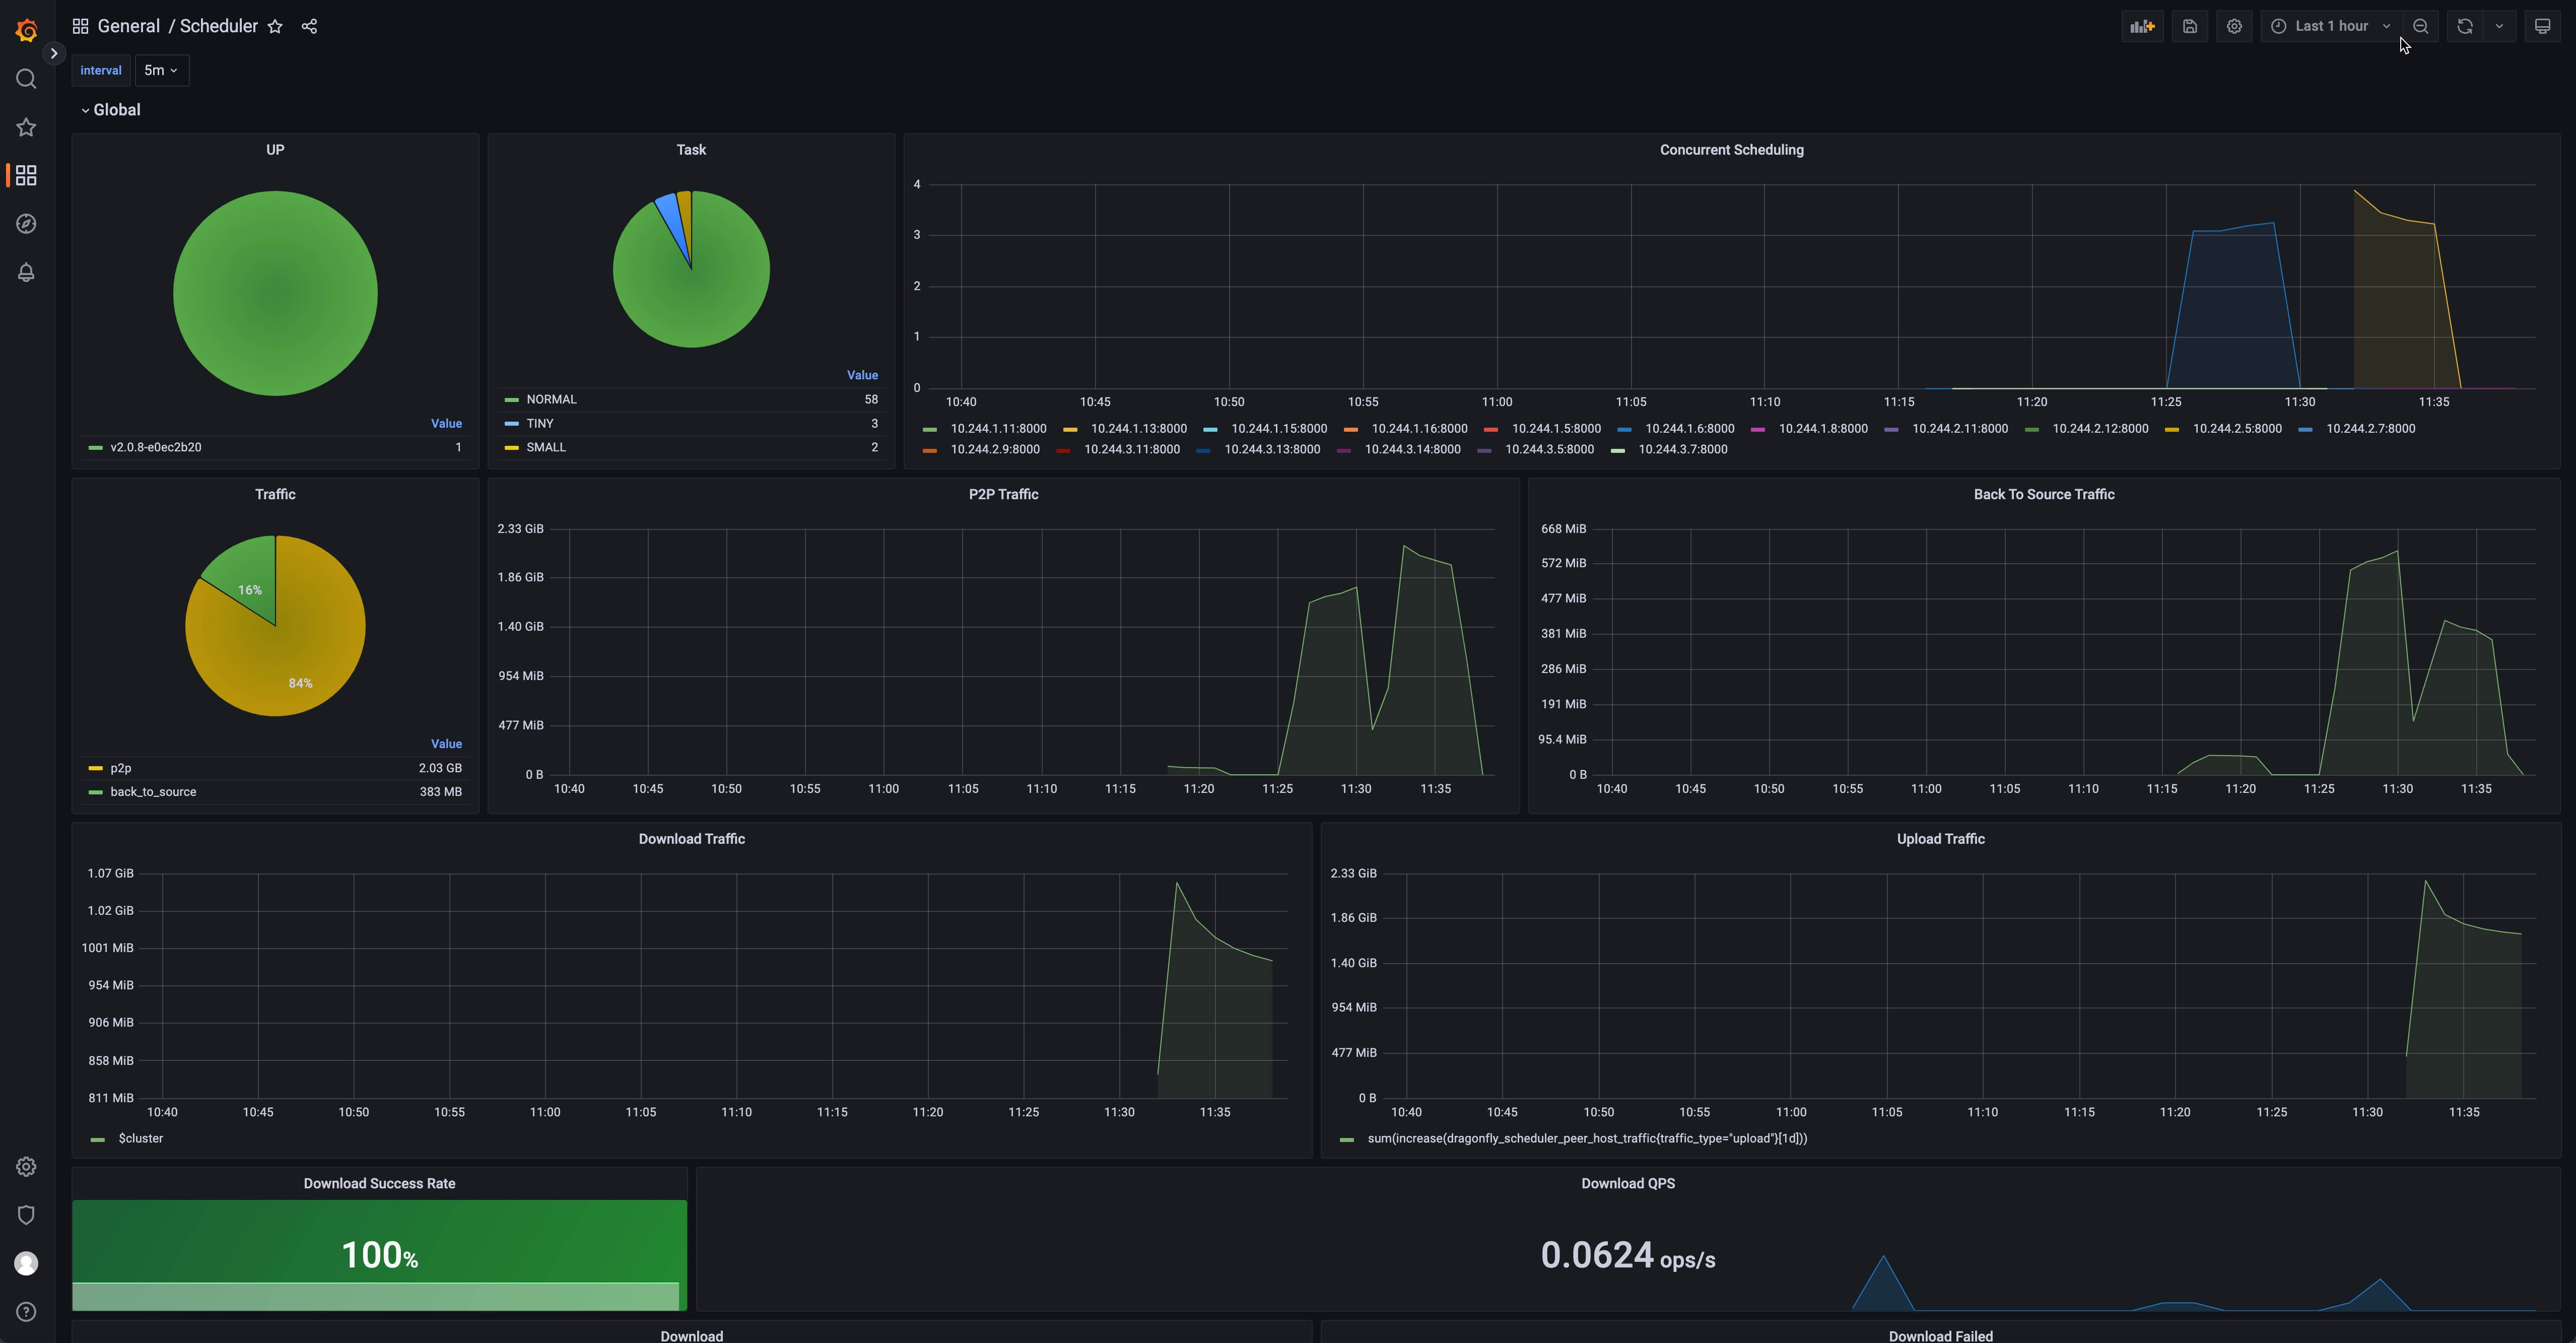
| Dragonfly Scheduler | 15944 | https://grafana.com/grafana/dashboards/15944 | Grafana dashboard for dragonfly scheduler. |
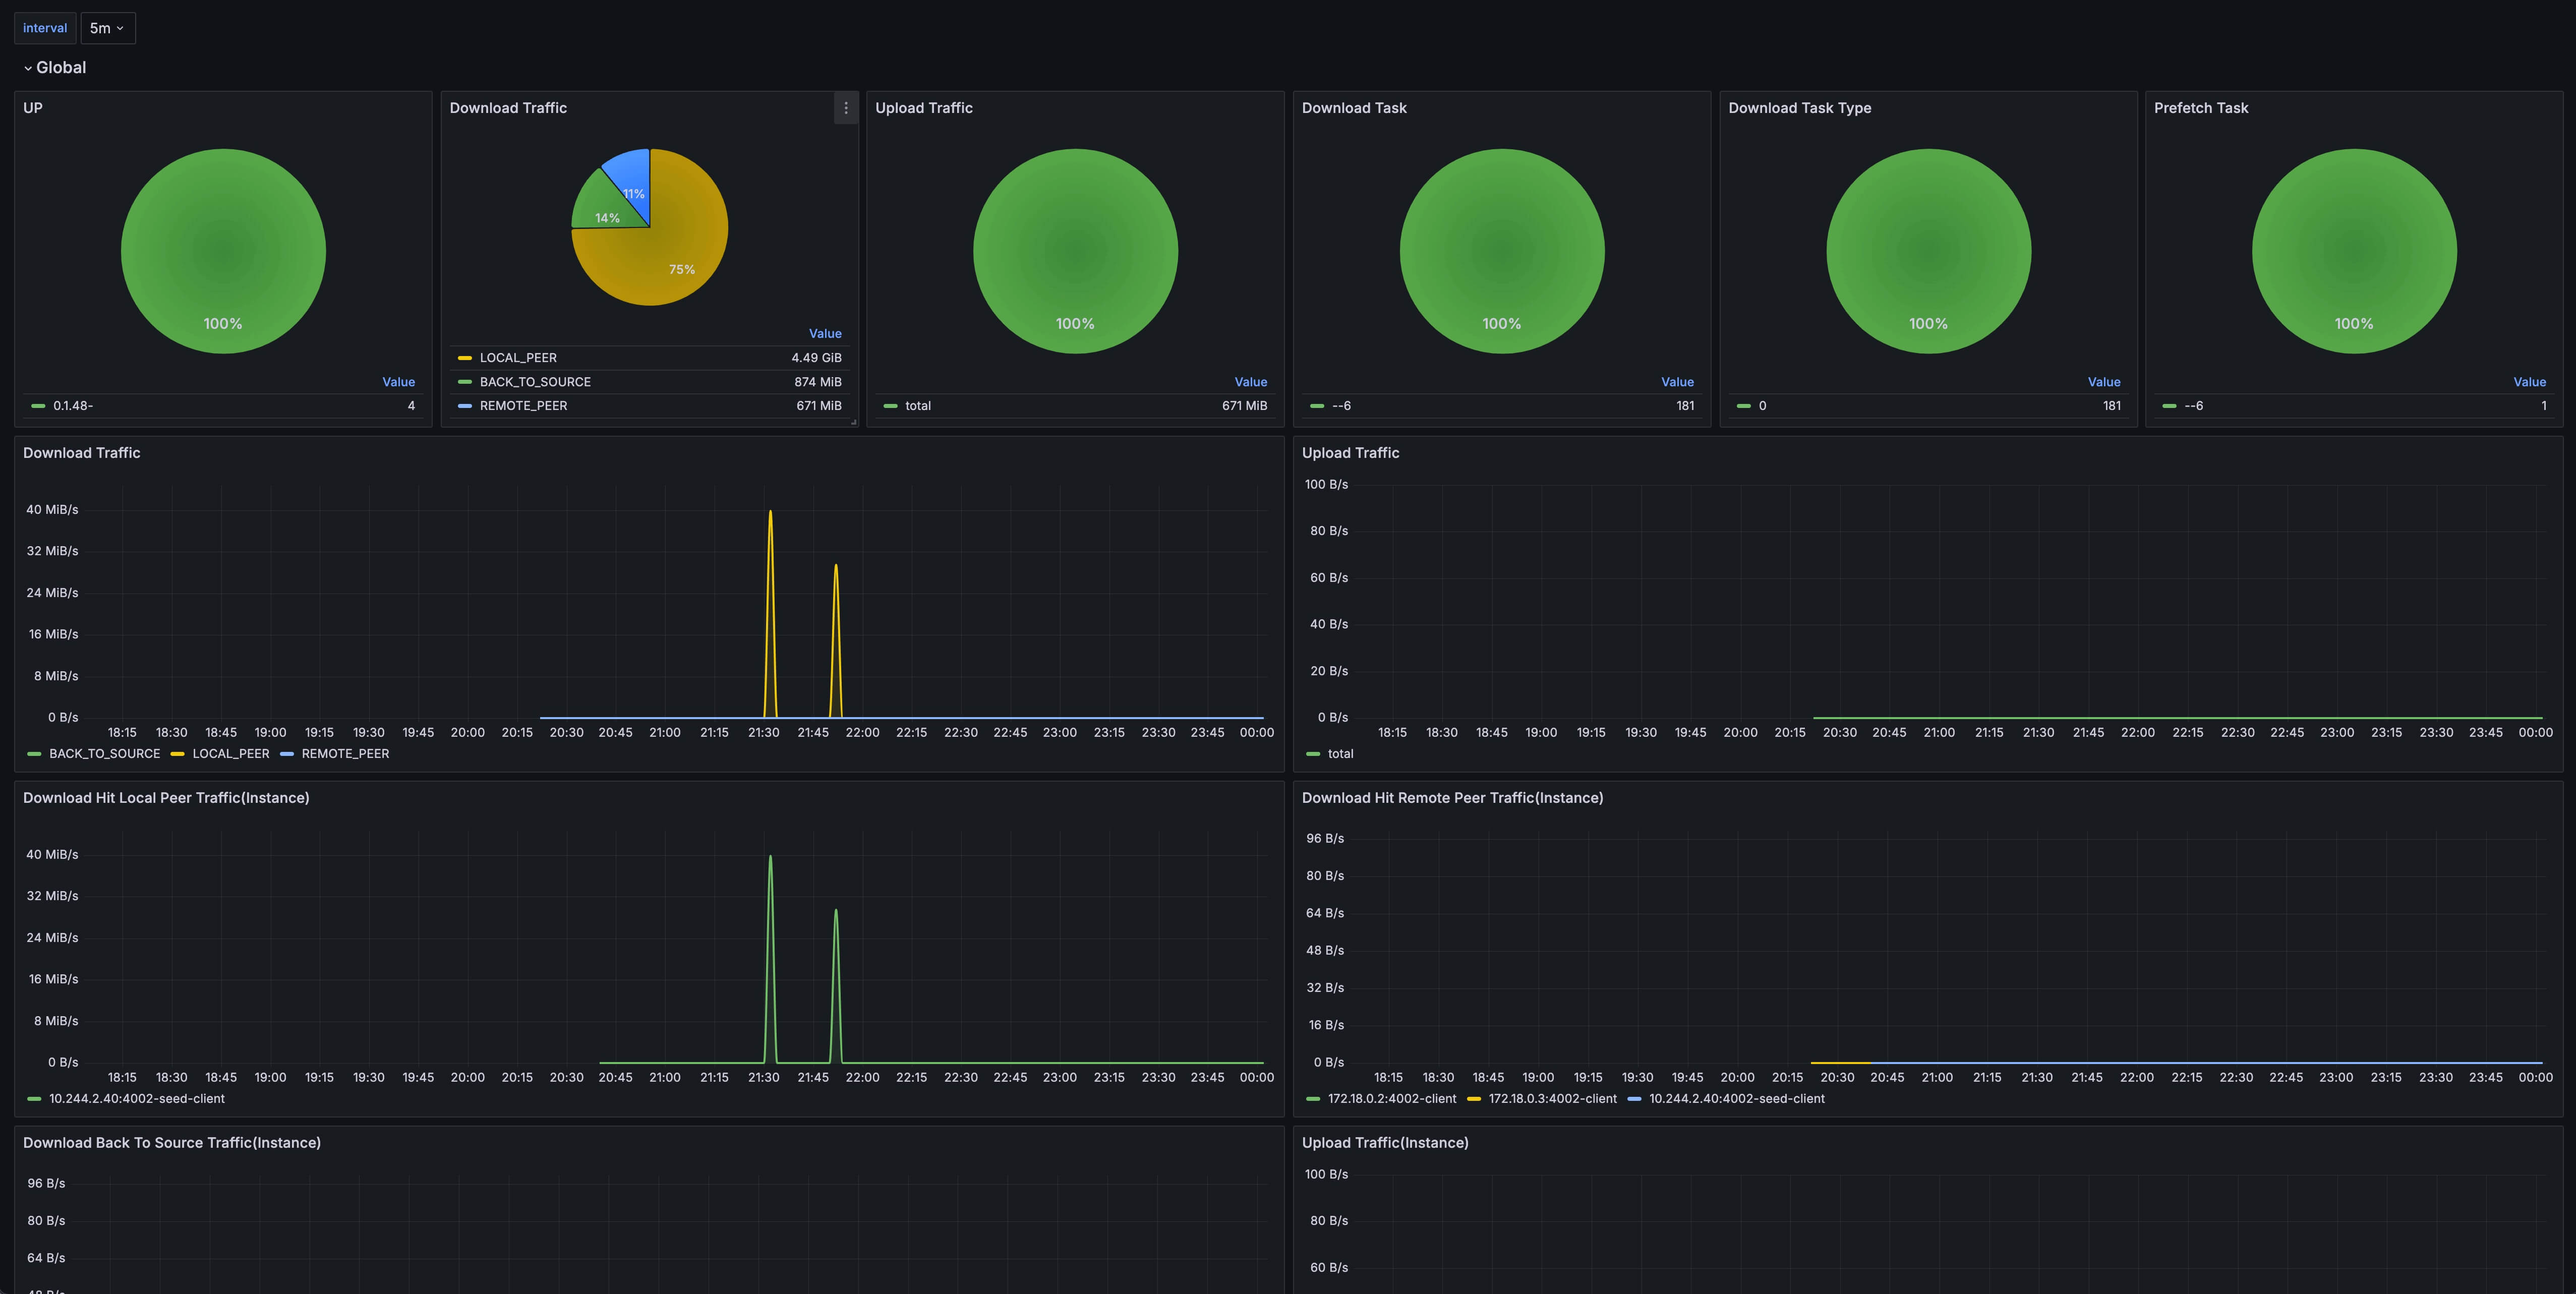
| Dragonfly Client | 21053 | https://grafana.com/grafana/dashboards/21053 | Grafana dashboard for dragonfly client and dragonfly seed client. |
| Dragonfly Seed Client | 21054 | https://grafana.com/grafana/dashboards/21054 | Grafana dashboard for dragonfly seed client. |
Import Dragonfly grafana dashboard using ID, IDs are 15945, 15944, 21053 and 21054, refer to export-import.
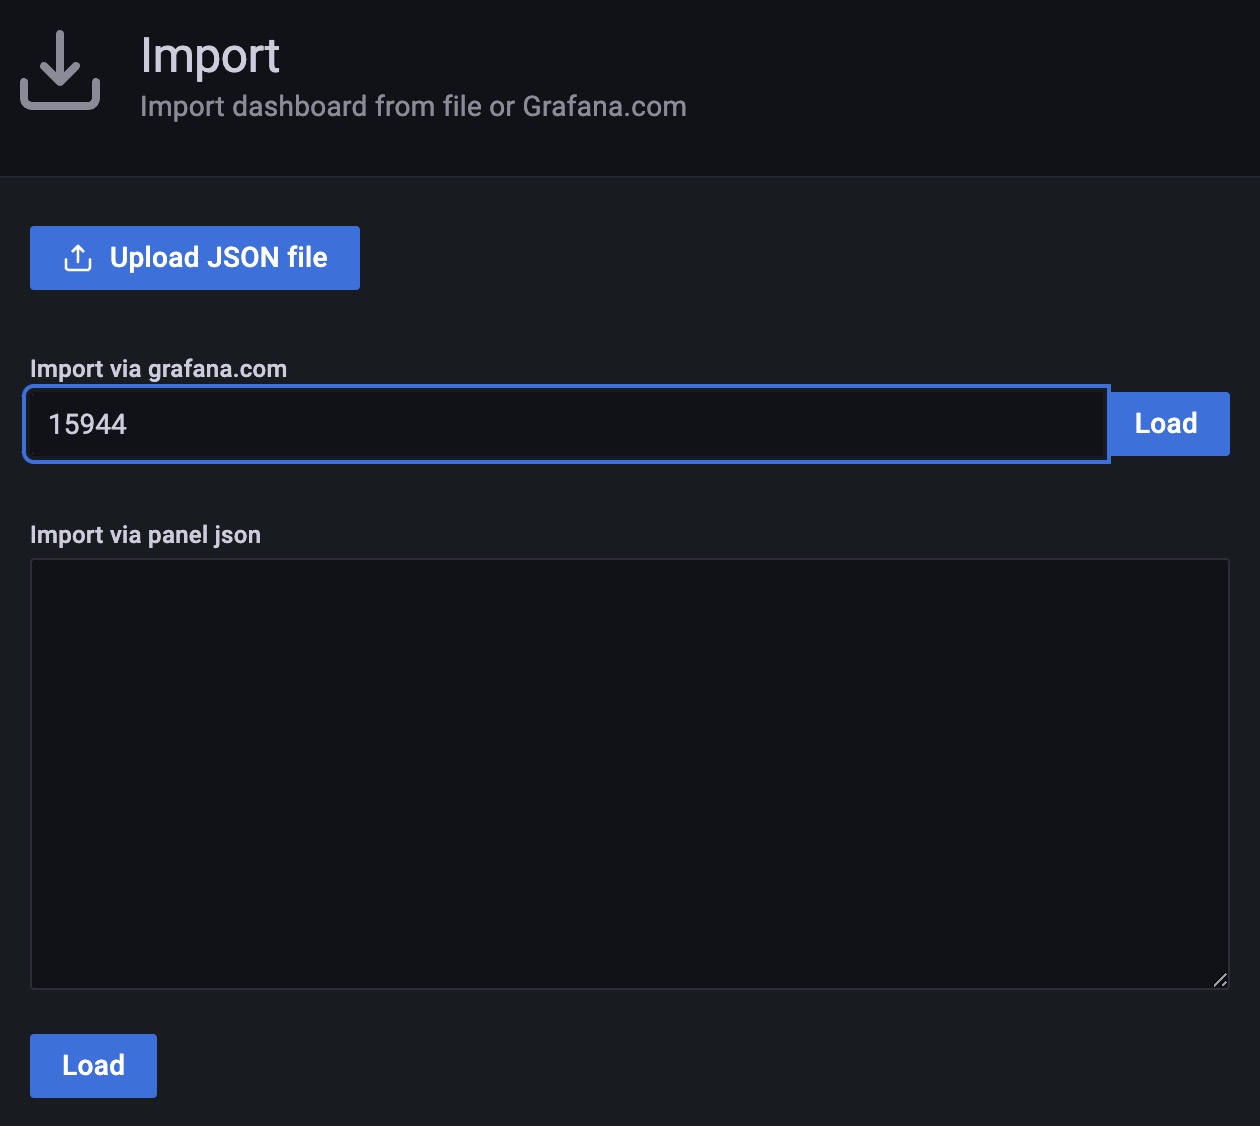
Import Dragonfly grafana dashboard successfully, you can visit the dashboard