Tracing
This document provides a guide on how to set up tracing for Dragonfly, which is essential for monitoring and debugging distributed systems.
Setup Jaeger
Set up a Jaeger instance to collect and visualize tracing data from Dragonfly components, refer to the Jaeger documentation for detailed instructions.
docker run --rm --name jaeger \
  -p 16686:16686 \
  -p 4317:4317 \
  -p 4318:4318 \
  -p 5778:5778 \
  -p 9411:9411 \
  jaegertracing/jaeger:2.3.0
Configure the tracing endpoint in Dragonfly
Add tracing configuration as follows(in Manager, Scheduler and Dfdaemon)
tracing:
  # Protocol to use for tracing.
  protocol: grpc
  # Jaeger endpoint url, like: jaeger.dragonfly.svc:4317.
  endpoint: jaeger.dragonfly.svc:4317
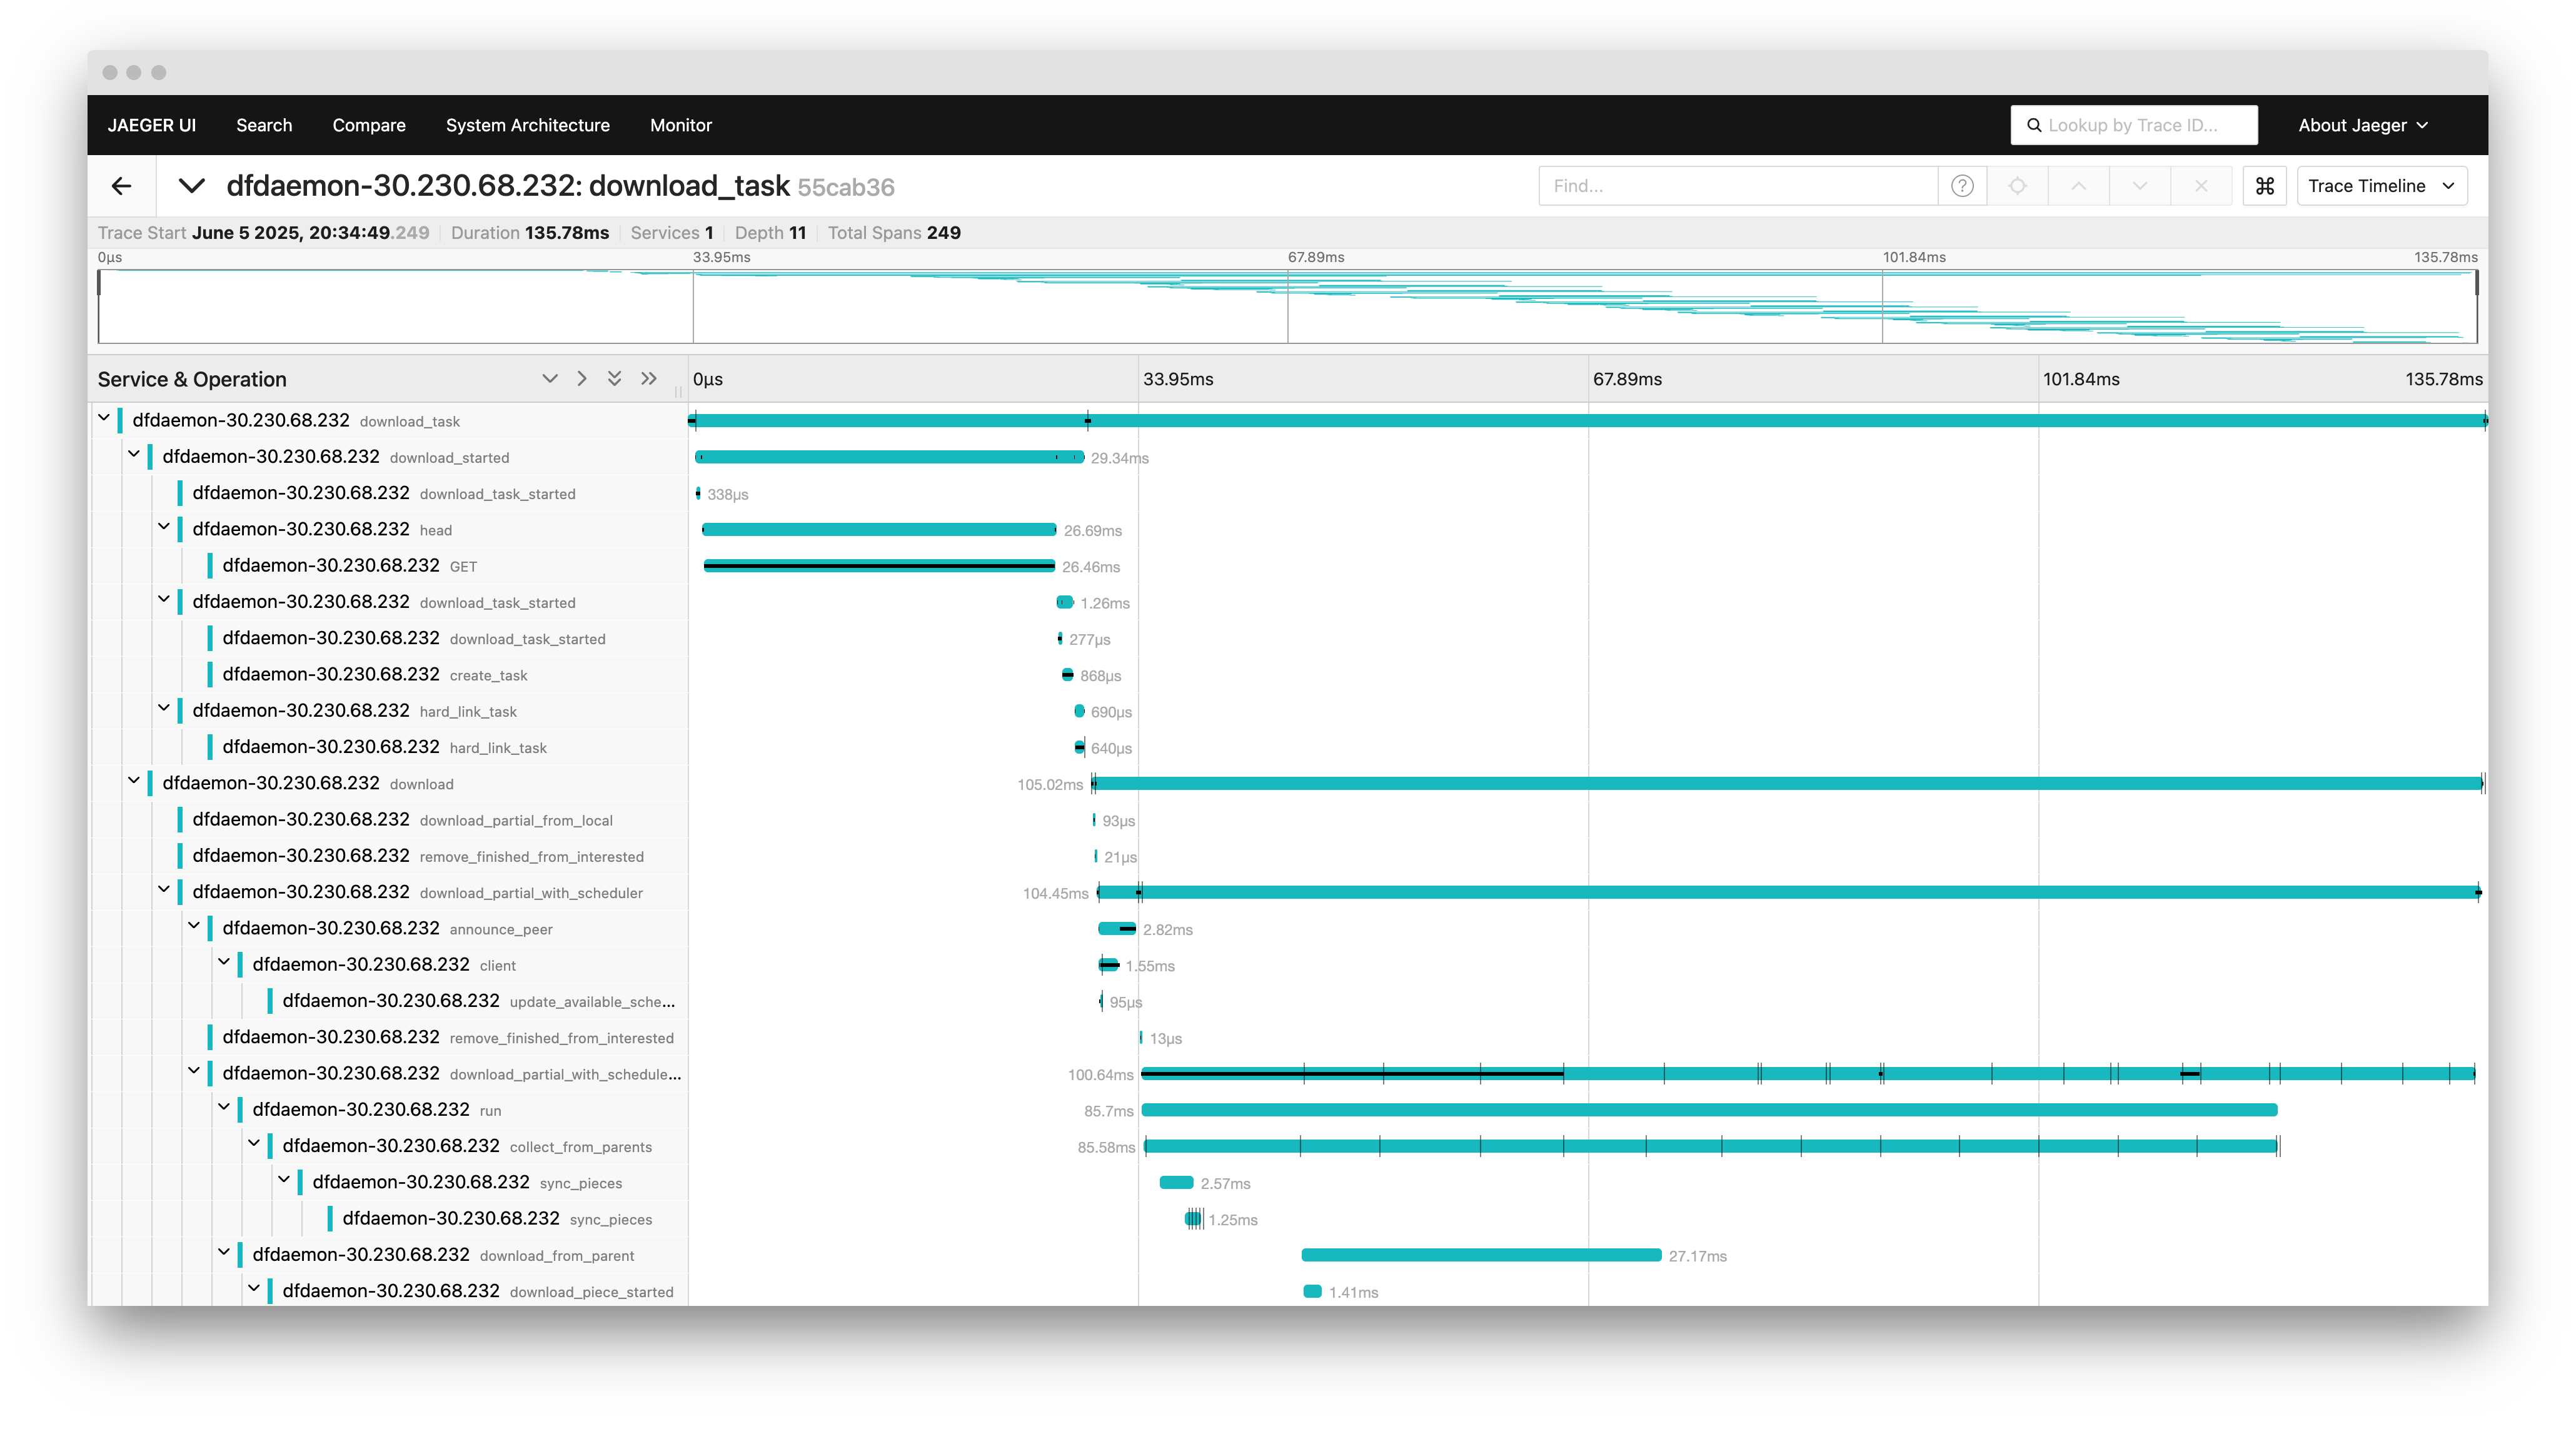
Access the Jaeger UI
Jaeger will automatically collect the tracing data from Dragonfly components.
You can access the Jaeger UI at http://localhost:16686 to visualize the traces.